
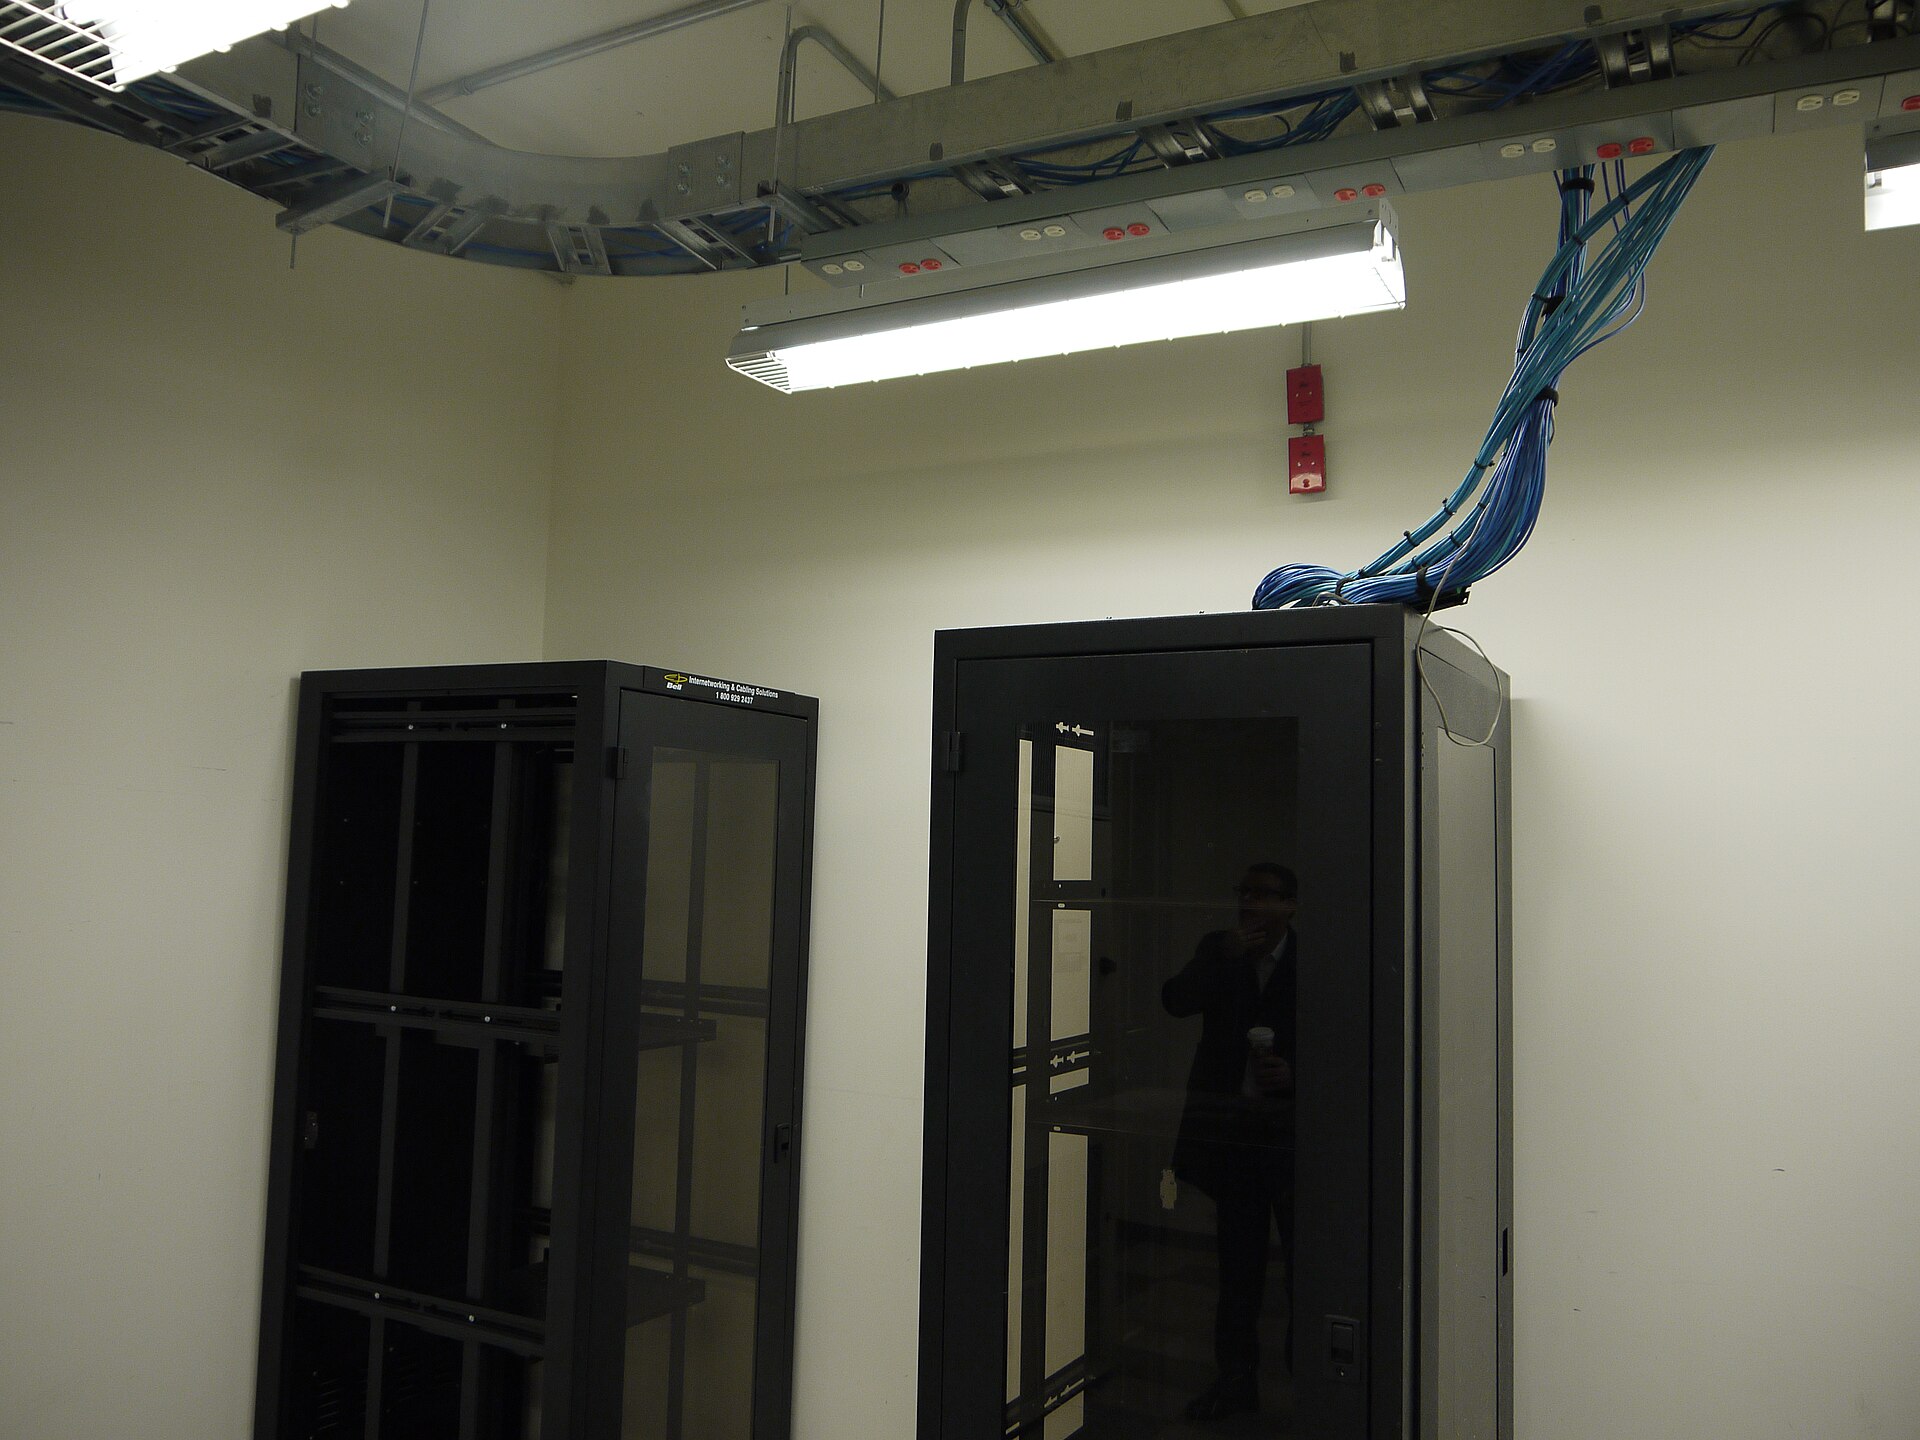
A single NVIDIA GB200 NVL72 rack holds 72 GPUs, 36 CPUs, 13.4 terabytes of high-bandwidth GPU memory and a spine of copper cable so dense the whole thing has to be plumbed with liquid coolant. It behaves, for programming purposes, as one very large computer. Wire 128 of them together and you have a 9,216-GPU cluster.
That rack reshaped data centre design. For twenty years the industry optimised around racks drawing under 10 kilowatts, cooled by moving cold air around a room. AI racks broke that assumption, and everything downstream — cooling, power distribution, water, the grid connection — has been scrambling to catch up.
Here is what is actually inside one of these buildings, how the pieces connect, and where the real constraints are. Some of the most-quoted numbers in this field are softer than they look, and it is worth being precise about which ones are solid.
What is actually in the rack
Take the GB200 NVL72 as the reference design, since most 2025–2026 AI infrastructure is a variation of it. Per NVIDIA’s technical description, the rack contains 18 compute trays and nine NVLink switch trays.
Each compute tray holds two Grace CPUs and four Blackwell GPUs, arranged as two Grace Blackwell Superchips. That gives 72 GPUs and 36 CPUs per rack, with 30TB of unified memory across the rack and 1.7TB of fast memory per compute tray. Inside each Superchip, the CPU and GPU talk over an NVLink chip-to-chip link running at 900GB/s bidirectionally.
The nine switch trays are the interesting part. Between them they provide 144 NVLink ports, and every GPU gets 1.8TB/s of bidirectional bandwidth into that fabric, for 130TB/s aggregate across the rack. The GPUs are wired with a copper cable cartridge rather than optics — cheaper and lower-power over short distances, and a large part of why the rack is so physically dense.
The successor, the GB300 NVL72, keeps the same shape — 72 GPUs, 36 CPUs, 130TB/s of NVLink — but expands memory substantially: 37TB of total fast memory, of which 20TB is GPU memory running at up to 576TB/s, alongside 17TB of LPDDR5X CPU memory and 2,592 Arm Neoverse V2 CPU cores. Its headline compute figure is 1,440 petaflops at FP4 precision.
Why memory, not compute, is usually the limit
The headline flops number is the least useful spec on the sheet. Whether a model runs at all depends on its weights fitting in GPU memory; how fast it generates tokens depends on how quickly those weights can be read out of memory.
That is why HBM — high-bandwidth memory, stacked vertically on the same package as the GPU — matters so much, and why the GB300’s jump from 13.4TB to 20TB of GPU memory is a bigger deal than any flops comparison. It is also why NVIDIA quotes a bandwidth figure (576TB/s) beside the capacity. HBM supply, not GPU logic manufacturing, has been the tighter constraint.
Scale-up versus scale-out
These are the two networks in an AI data centre, and confusing them is the most common mistake in coverage of the topic.
Scale-up means making one machine bigger. Inside the rack, NVLink connects all 72 GPUs into a single memory-coherent domain, so a model’s layers can be split across GPUs that behave almost like one device. NVIDIA states this domain can extend to 576 GPUs with over 1PB/s of total bandwidth. Scale-up is fast and expensive, and it does not extend across a building.
Scale-out means connecting many machines. That is a conventional network, and it runs at a fraction of NVLink’s bandwidth.
NVIDIA’s DGX SuperPOD reference architecture wires this as five logical networks over four physical fabrics: the multi-node NVLink fabric, a compute fabric on InfiniBand, a combined storage and in-band management fabric on Ethernet, and a separate out-of-band management network.
The compute fabric uses a rail-aligned leaf-spine topology built as a non-blocking fat tree. A scalable unit is 576 GPUs; sixteen of those units gives 9,216 GPUs, needing 512 leaf switches and 384 InfiniBand spine switches for the compute network alone. Storage runs over Ethernet with RoCE at 4x200GbE per node via BlueField-3 DPUs, with 16x800Gbps of non-blocking bandwidth to storage per unit.
| Scale-up (NVLink) | Scale-out (InfiniBand/Ethernet) | |
|---|---|---|
| Reach | Within a rack, up to 576 GPUs | Across a building, thousands of GPUs |
| Bandwidth | 1.8TB/s per GPU | 800Gb/s per GPU on ConnectX-8 |
| Medium | Copper cable cartridge | Optics and switches |
| Used for | Splitting one model across GPUs | Gradient exchange, data, storage |
The InfiniBand-versus-Ethernet question is genuinely contested. InfiniBand has lower latency and mature congestion control; Ethernet is cheaper, more familiar and improving quickly. NVIDIA sells both — Quantum-X800 InfiniBand and Spectrum-X Ethernet — and the GB300’s ConnectX-8 SuperNIC gives each GPU 800Gb/s over either. Reasonable operators choose differently.
Why it has to be liquid-cooled
Air cooling works up to a point, and that point is lower than most people assume. Uptime Institute survey data put mean rack density at around 8.4kW as recently as 2020, with two-thirds of respondents below 10kW. Six years later the picture has moved, but less than the headlines suggest. An Uptime analysis published on 29 July 2026 reports that typical rack densities are shifting toward 10kW, with more than a quarter of operators above that. It puts the point where direct liquid cooling becomes economically justified at 20–30kW per rack, and notes that above roughly 20–25kW the capital cost advantages of packing racks more densely start to thin out.
An NVL72-class rack sits far above that threshold. NVIDIA calls the GB200 NVL72 “a liquid-cooled, rack-scale design” and publishes no single rack wattage; it quotes efficiency in relative terms instead — 25 times more performance at the same power as an air-cooled H100 system, and for the GB300 a five-fold throughput gain per megawatt over Hopper. Note the unit those comparisons use.
In practice, liquid cooling here means cold plates bolted directly to the GPU and CPU packages, with coolant circulated by a distribution unit that exchanges heat with the facility water loop. The SuperPOD architecture even adds a dedicated link to the building management system so cooling and power can be coordinated with the compute.
The operational catch is thermal mass. The same Uptime analysis notes a low-density air-cooled hall can ride through a cooling failure for several minutes, sometimes tens of minutes. A high-density system on cold plates cannot tolerate more than a few seconds. Cooling redundancy stops being optional.
Power density and the wobble
There is a second, less discussed problem: AI power draw is not steady. A separate Uptime piece from December 2025 reports that AI compute clusters can reach 150% of their steady-state maximum power levels during synchronised spikes, because thousands of GPUs execute the same training step at the same instant.
That has consequences at both ends. Inside the rack, repeated thermal cycling degrades voltage regulators, solder joints and capacitors, and power supplies are strained by rapid current swings; spikes can trip overcurrent protection and cause unplanned reboots. Outside, the swings show up on the grid, and UPS systems forced to discharge repeatedly wear out faster.
Mitigations are unglamorous: oversize branch circuits, spread GPUs across racks, cap GPU power in software, overprovision rack-level UPS capacity, and plan for shorter replacement cycles.
PUE, and what it hides
Power usage effectiveness is total facility power divided by IT power. A PUE of 1.5 means half a watt of overhead per watt of computing.
It improved sharply and then stopped. Uptime’s own history has the industry average at roughly 2.5 in 2007, 1.98 in 2011, 1.65 in 2014, and then stuck between about 1.55 and 1.59 from 2020 to 2023. The cheap wins — blanking panels, hot-aisle containment, better compressors — were taken, and the survey’s geographic mix shifted toward hotter climates. Facilities built in the past five years average nearer 1.45. The best operators are far ahead of that.
| Operator / source | PUE | Period |
|---|---|---|
| Uptime Institute survey average | 1.54 | 2025 global survey |
| Microsoft, global fleet | 1.17 | FY25 |
| Google, global fleet (trailing 12 months) | 1.09 | 2025 |
Google reports a fleet-wide trailing-twelve-month PUE of 1.09, measured across all its large-scale sites in all seasons, and cites Uptime’s 2025 survey average of 1.54 for comparison. Microsoft reports 1.17 globally for FY25.
The limitation matters: PUE says nothing about whether the computing is useful. A hall full of idle GPUs can post an excellent PUE. The IEA’s Energy and AI report puts servers at around 60% of data centre electricity and cooling at 7% to 30% depending on design — so once cooling overhead is squeezed, the remaining lever is making servers do more per watt.
Water
Water use effectiveness (WUE) measures litres consumed per kilowatt-hour of IT load. It varies enormously with climate and cooling design, and the trade-off against PUE is direct: evaporative cooling saves electricity by spending water.
Microsoft’s FY25 figures show the spread. Global WUE was 0.27 L/kWh, but the regional breakdown runs from 0.34 L/kWh in the Americas to 0.25 in Asia Pacific and 0.03 in Europe, Middle East and Africa — a tenfold difference driven by which sites evaporate water and which run closed loops.
Closed-loop designs, where coolant circulates continuously rather than evaporating away, largely remove operational water use at the cost of more electricity for chillers. As AI racks force a move to liquid cooling anyway, this is where the industry is heading — which makes the electricity problem slightly worse.
The grid connection problem
This is now the binding constraint on AI capacity, more than chips or capital. The IEA put global data centre electricity consumption at around 415TWh in 2024, roughly 1.5% of world electricity, growing about 12% a year since 2017 — more than four times faster than overall electricity demand. Its base case has that reaching around 945TWh by 2030 and about 1,200TWh by 2035. It describes a typical AI-focused facility as consuming as much electricity as 100,000 households.
In the United States, the 2024 Lawrence Berkeley National Laboratory report for the Department of Energy, published 20 December 2024, found data centres used about 176TWh in 2023, or 4.4% of national electricity, and projected 325–580TWh by 2028 — between 6.7% and 12% of the total. That is a wide range, and the width is honest: it depends on assumptions nobody can pin down.
Getting power connected is the hard part. Berkeley Lab’s Queued Up 2026 report, published June 2026 with data through end-2025, found roughly 2,060GW of generation and storage capacity actively seeking grid connection across about 8,200 projects. The median time from request to commercial operation for projects completed in 2025 was over five years. Of capacity requested between 2000 and 2020, only 13% reached operation by end-2025; 75% was withdrawn.
The IEA adds that around 20% of planned data centre projects could face delays from grid strain, and that wait times for transformers and cables have doubled in three years. That is why operators are signing power purchase agreements for geothermal and nuclear output and building on-site generation.
The economics, in plain terms
Three facts drive the business model.
- The asset depreciates fast. Accelerators are replaced on a cycle measured in a few years, and the December 2025 Uptime analysis suggests AI power cycling may shorten hardware life further. Idle time is expensive in a way it never was for a web server.
- Power is the scarce input. When a connection takes five years, a site with existing interconnection is worth far more, independent of anything about the building.
- Efficiency gains land on the electricity bill. NVIDIA’s marketing has shifted from performance to performance per megawatt, a fair signal of what customers are constrained by.
Treat confident total-cost figures with caution. Hyperscalers do not break out AI infrastructure spend cleanly, useful-life assumptions differ between operators, and utilisation rates are not published. The energy and interconnection numbers above come from government and institutional sources and are the most solid ground available.
What this means for you
If you buy cloud compute, the specification that matters is usually memory, not flops. Ask how much GPU memory an instance exposes and what its interconnect is: an eight-GPU node stitched together with ordinary Ethernet behaves very differently from a slice of an NVLink domain, whatever the flops figure says.
If you are evaluating a colocation provider for AI hardware, ask about supported density in kW per rack, whether facility water is available for direct liquid cooling, the cooling ride-through time, and whether the site’s grid connection is energised or still queued.
If a data centre is proposed near where you live, the two figures that describe its impact are its contracted electrical capacity in megawatts and its cooling design. A closed-loop facility uses little water and more electricity; an evaporatively cooled one is the reverse.
Frequently asked questions
How many GPUs are in a typical AI training cluster?
NVIDIA’s reference architecture scales in units of 576 GPUs, up to 16 units for 9,216 GPUs in a single SuperPOD. Large frontier training runs use clusters built from multiples of that.
Why not just use more air cooling?
Because the economics invert. Uptime’s 2026 analysis puts direct liquid cooling’s break-even at 20–30kW per rack, and an NVL72-class rack is well past that. Air cooling at those densities requires so much fan power and floor space that liquid becomes cheaper.
Is a low PUE the same as being efficient?
No. PUE only measures overhead outside the IT load. A facility running underutilised hardware can have an excellent PUE while wasting most of the energy it draws. It is a facilities metric, not a computing metric.
Do AI data centres really use a lot of water?
It depends entirely on the cooling design. Microsoft’s own FY25 numbers span 0.03 to 0.34 litres per kWh across regions. Closed-loop sites consume very little; evaporatively cooled sites in hot, dry regions consume much more.
Why does connecting to the grid take so long?
Interconnection studies, transmission upgrades and equipment lead times. Berkeley Lab found a median of over five years from request to operation for projects completed in 2025, and only 13% of requested capacity from 2000–2020 ever reached operation.
Where the bottleneck sits now
The engineering story of the past three years is that the computer got denser faster than the building around it could adapt. A rack went from a box of servers drawing under 10 kilowatts to a single liquid-cooled machine with 72 accelerators and 20 terabytes of high-bandwidth memory, wired internally with copper.
Everything difficult now sits outside that rack. Cooling loops with seconds of thermal margin. Power that swings to 150% of nominal when ten thousand GPUs step in unison. A five-year median wait for a grid connection, in queues holding two terawatts of proposed capacity.
None of that is solved by a faster chip. The next few years of AI infrastructure will be decided by transformers, substations, water rights and interconnection agreements — a less exciting story than the silicon, and a more consequential one.
Sources
- NVIDIA — GB200 NVL72
- NVIDIA — GB300 NVL72
- NVIDIA Developer Blog — GB200 NVL72 Delivers Trillion-Parameter LLM Training and Real-Time Inference
- NVIDIA Docs — DGX SuperPOD GB200 Reference Architecture: Network Fabrics
- Uptime Institute Journal — Lower density brings server efficiency and cooling gains
- Uptime Institute Journal — AI power fluctuations strain both budgets and hardware
- Uptime Institute Journal — Global PUEs: are they going anywhere?
- Google Data Centers — Efficiency
- Microsoft Datacenters — Efficiency
- IEA — Energy and AI, Executive Summary
- US Department of Energy — Report evaluating the increase in electricity demand from data centers
- Berkeley Lab — Queued Up: Characteristics of Power Plants Seeking Transmission Interconnection
Image credit: Photo: Mike Beltzner — CC BY-SA 2.0 (via Wikimedia Commons)
